The City of Austin Homelessness Dashboard
The City of Austin Homelessness Dashboard header, with a disclaimer dropdown and overview data cards.
The purpose of the dashboard was to gather data from across the Austin Continuum of Care, and distill it into a story of the work being done to end homelessness in our city. The primary users are members of City leadership that are using the data to make policy decisions. Secondary users are concerned residents and journalists.
More about the project
Early iterations
At first, our workgroup did not include a designer or developer. Our early prototypes focused more on long-form data storytelling, using Socrata. The feedback we received from City Council led us to scale back on content and focus on getting everything on a single page in a more traditional dashboard format.
An early prototype
How do we provide just enough content?
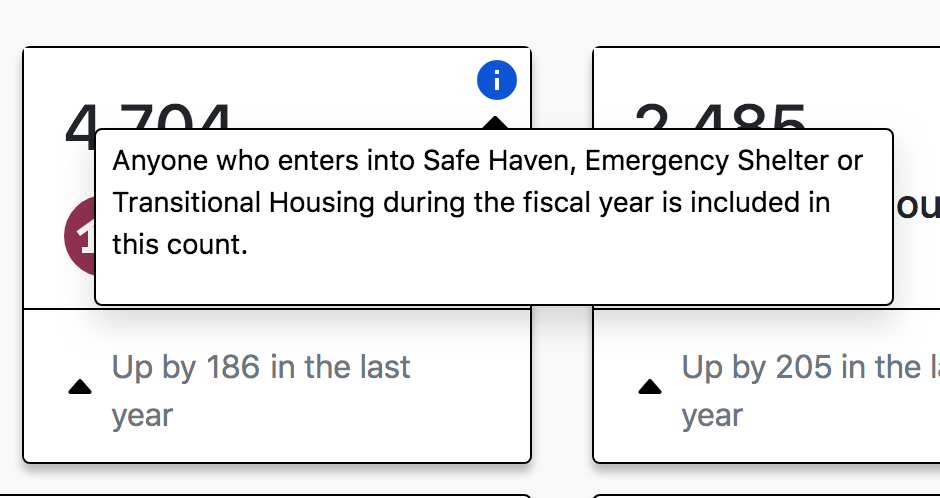
Because of the complexity of the data collection methods and the sensitivity of the subject matter, we needed to provide additional context. As we began to build out the custom dashboard, we were able to bring on a designer and developer. This allowed us to improve the design and implement things like a dropdown disclaimer and tooltips. Tooltips provided a low-lift way to elaborate on difficult data.
Tooltips provide context for the data.
Future iterations
We were able to conduct a round of usability tests with residents and finish research synthesis. We have many potential upgrades to make to the design and content. Testing taught us that the tooltips are not found easily enough, so figuring out another way to present that important content would be top priority.


